Motivation
Guaranteeing a stable power grid is crucial for modern economies. Recent developments towards a carbon neutral energy supply require continuously increasing contributions of intermittent energy carriers. To maintain the grid stability, reliable energy sources such as hydropower must flexibly compensate for the fluctuations in production and consumption. Given the long history of the latter energy carrier, an extensive, rather conventional fleet already exists. It is therefore a modern challenge on hydroengineering to investigate the suitability of existing powerplants for a wide range of strategies towards enhanced flexibility.
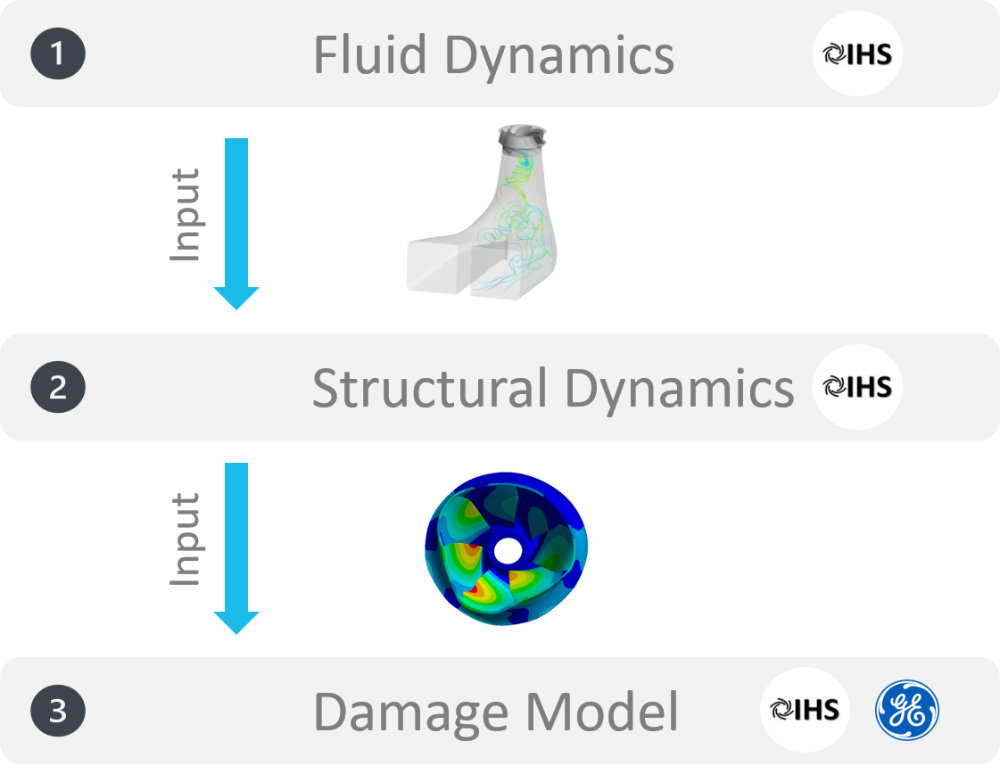
In the European project XFLEX Hydro, widening the range of power output of existing powerplants towards low load conditions is one of the strategies under investigation. The altered flow and structural behavior in the turbomachinery is one of the main challenges introduced by this strategy as it directly affects the durability of the mechanical components and consequently the safety of the powerplant. Therefore, a thorough investigation of structural and flow behavior applying a multitude of computational (Fig. 1) and experimental approaches is imperative.
Structural analysis in deep partial load
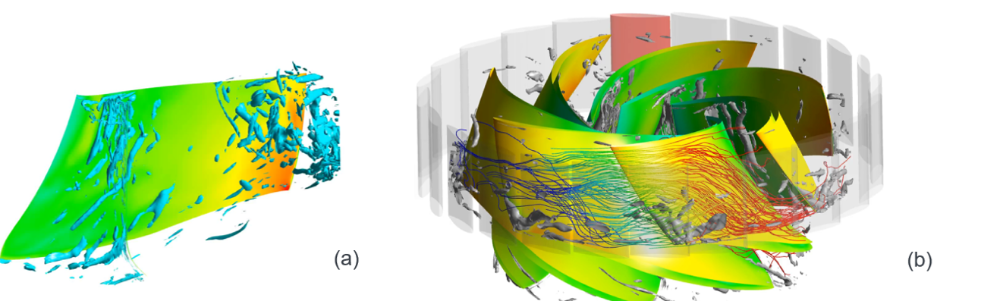
The structural dynamic analyses are demonstrated for the Alqueva II pump-turbine runner in deep partial load (DPL). Pressure field fluctuations obtained from unsteady CFD simulations are mapped onto the structure as external loading. For optimal resource efficiency, the spectral content is sorted into near-resonant and low-frequency excitations. In this case, the near resonant excitations consist of the pressure pulsation modes originating from the interaction between the stationary guide vanes and the rotating runner blades (RSI). The rest is induced by chaotic local vorticity structures on medium to small geometric scales (Fig. 2). The classification of the frequency content is applied, based on a coupled acoustic-structural modal analysis.
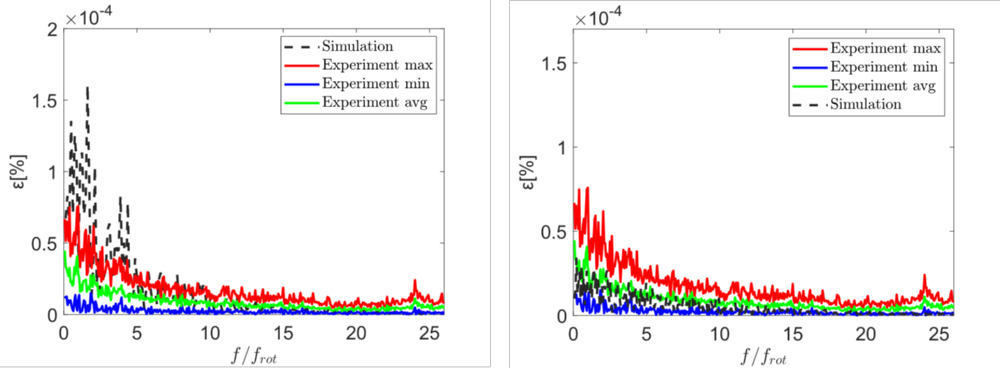
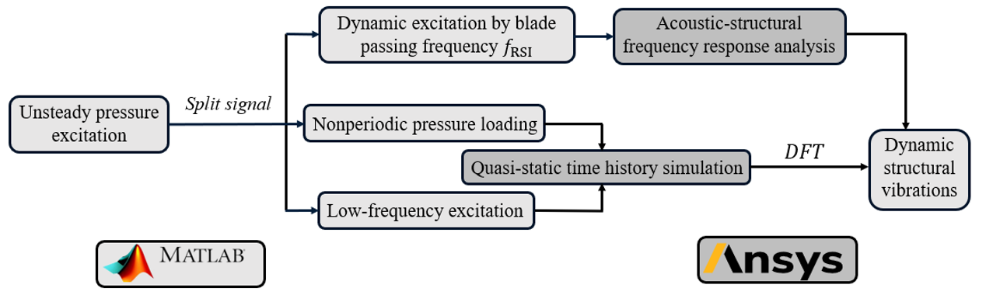
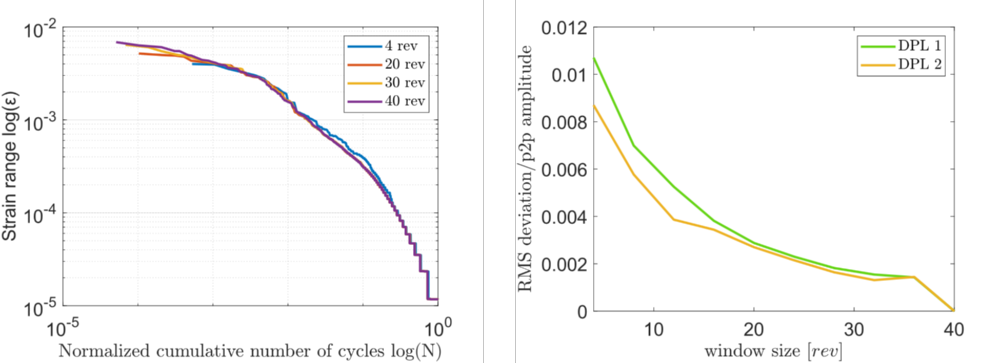
Depending on the excitation frequencies, two different FE simulation approaches are applied (Fig. 3). Time history analyses are conducted under the chaotic low-frequency loading. Herein, inertia and damping are omitted in the structural model. The RSI excitation modes are filtered from the total pressure excitation and mapped onto the structure in a harmonic vibro-acoustic fluid-structure-interaction (FSI) simulation to account for inertia and damping, especially the added mass effect. The obtained results are superimposed in form of frequency spectra to enable a validation against experiments. In a next step, the obtained strain fluctuations are extracted at positions of potential crack initiation. At these positions, strain gauge measurements on the prototype machine are available. As a final step, the numerical outcome is compared to experimental data to identify a reliable numerical analysis workflow in DPL.
Results
The modal analysis reveals that the frequency of the 3ND mode (spatial wave number 3) is in proximity of the main RSI frequency. The latter exhibits in turn an equal wave number of 3, making it the criterium for the choice of the FE method. The required time window width for the analysis is fixed at the temporal equivalent of 20 runner revolutions based on the RMS deviation between frequency spectra.
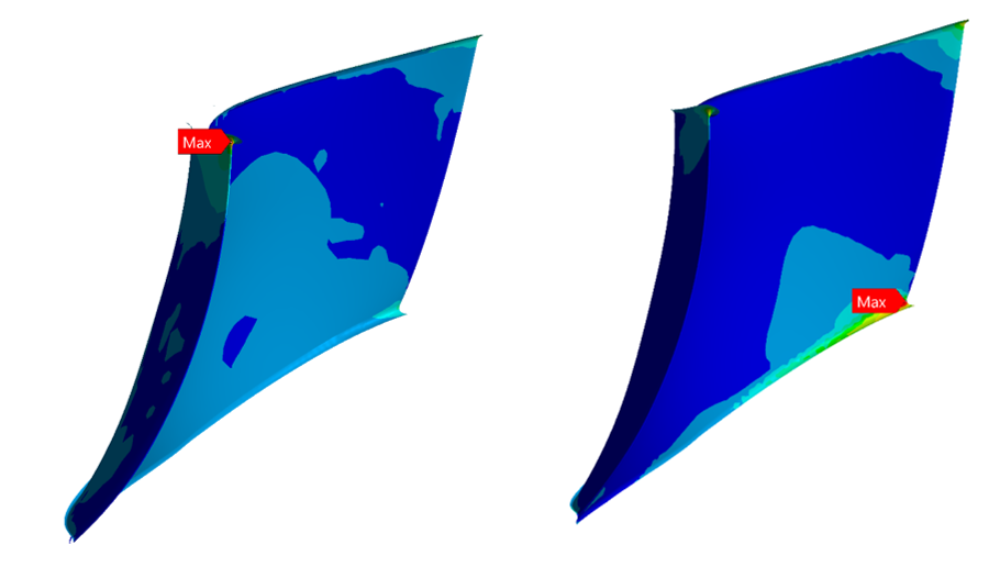
Another rather novel observation made in this work is that the critical spot regarding fatigue damage shifts, depending the operating conditions, between the leading edge near the shroud to the trailing edge near the hub.
To match the experimental measurements, unsteady pressure values from a CFD simulation with 80 million elements and the SBES turbulence model are applied. Comparable results are reached with a 25M mesh and the SBES model, but not with the SST model due to the overestimation of the pressure fluctuations. The impact of the errors observed in the SST pressures on the fatigue damage is investigated. Herein, one important conclusion is that for comparable pump turbine runners in DPL, unsteady CFD pressure fields can be generated using 25M element SBES flow simulations and lead to representative vibration prediction in subsequent structural analyses.