Motivation
The increasing share of renewable energies in the electric power grid requires more flexible operation and faster controllability for hydropower plants. Pumped storage power plants are particularly affected by this, as they are able to respond quickly to grid requirements thanks to their usually large storage capacity and their ability to make a significant contribution to the stabilization of the electrical grid. Ever more frequent and faster operating point adjustments lead to special loads on the components of the power plant, especially on the hydraulic machines. These can significantly influence the downtime of the power plant as well as the lifetime of the machines. One-dimensional simulations of these transient processes are not sufficient to investigate the stresses inside the machines in detail. Therefore, it is necessary to reproduce these transients in the laboratory on model machines to determine the loads and transfer the results to prototype size.
Transfer to Model Test-Rig
The information about the processes that should be investigated in the model experiment is base on measurements at the real power plant or can be obtained from 1D simulations of the power plant. When transferring the resulting parameters to the model size, the known laws of similarity for the geometry and the kinematics must be observed. Since the dynamic similarity to the prototype differs greatly due to the significantly smaller runner size, the model test is carried out at a higher rotational speed.
But a transient process also means a dependency on time. Thus, the rotational speed in the model experiment has an influence on the duration in which the process must be performed. This relationship can be described by the Strouhal number.
GLEICHUNG!
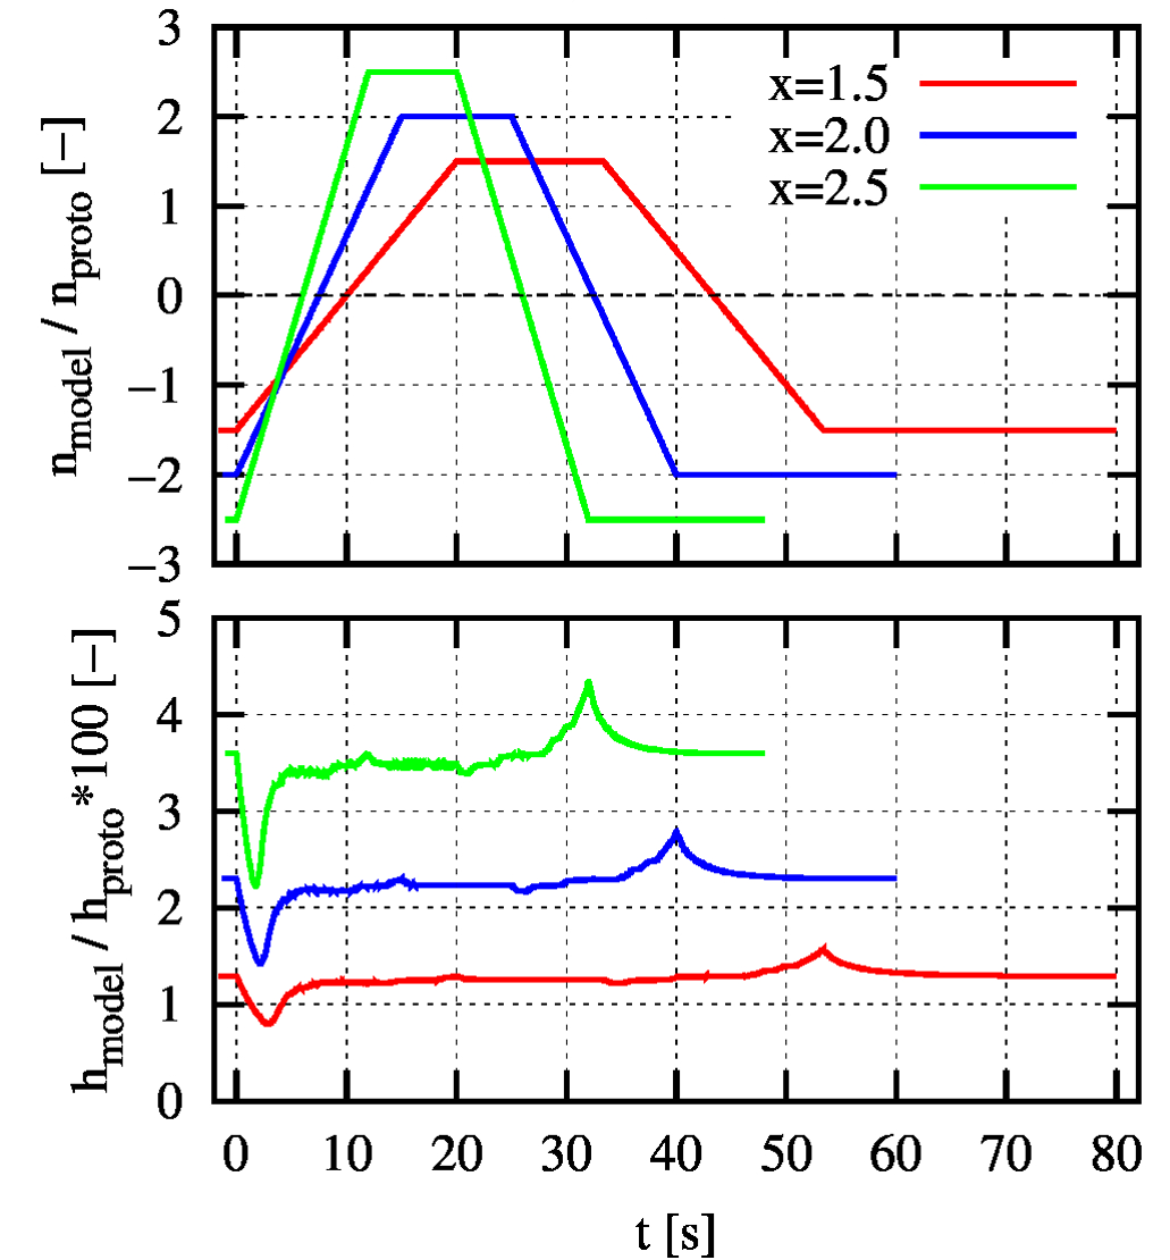
The transferred speed curves of a reversible pump turbine, for a linear fast transition from pump-to-turbine operation and vice versa, are shown for 1.5, 2 and 2.5 times model speed, Fig. 1.
The associated curves of the head which should be achieved in the model test are shown below. With a higher initial rotational speed of the model, the experiment gets closer to the dynamic similarity to the prototype. On the other hand, it can be seen that a higher model speed also leads to more significant extremes and gradients. This immediately increases the difficulty of the experiment.
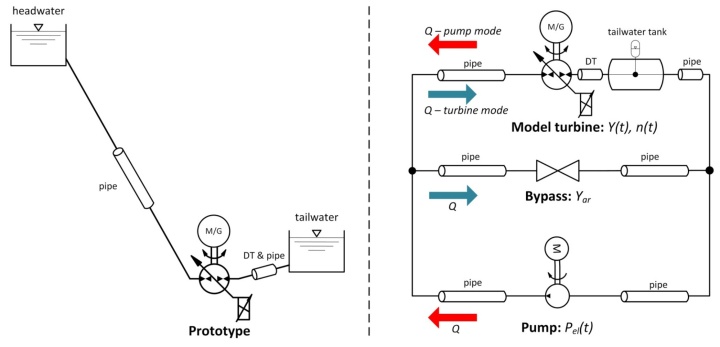
By comparing the different piping systems, it becomes clear that the behavior of the pressure wave propagation between the power plant and the test rig varies significantly (Fig. 2). In the test rig, the service pumps deliver the required time-dependent energy difference at the model turbine. A Bypass enables the transfer from pump mode to turbine mode and the associated volume flow reversal.
The challenge is the control of the test rig service pumps in order to achieve the transferred parameter curves at the model machine.
Simulation of the Test Rig
With the help of 1D simulations of the test rig and an optimization algorithm, parameters such as the opening of the bypass valve and the exact operating behavior of the service pumps can be determined. The simulation model contains the entire test rig with all its characteristic components. The simulations are carried out with the software SIPROHS, which was developed at the IHS and is constantly being expanded.
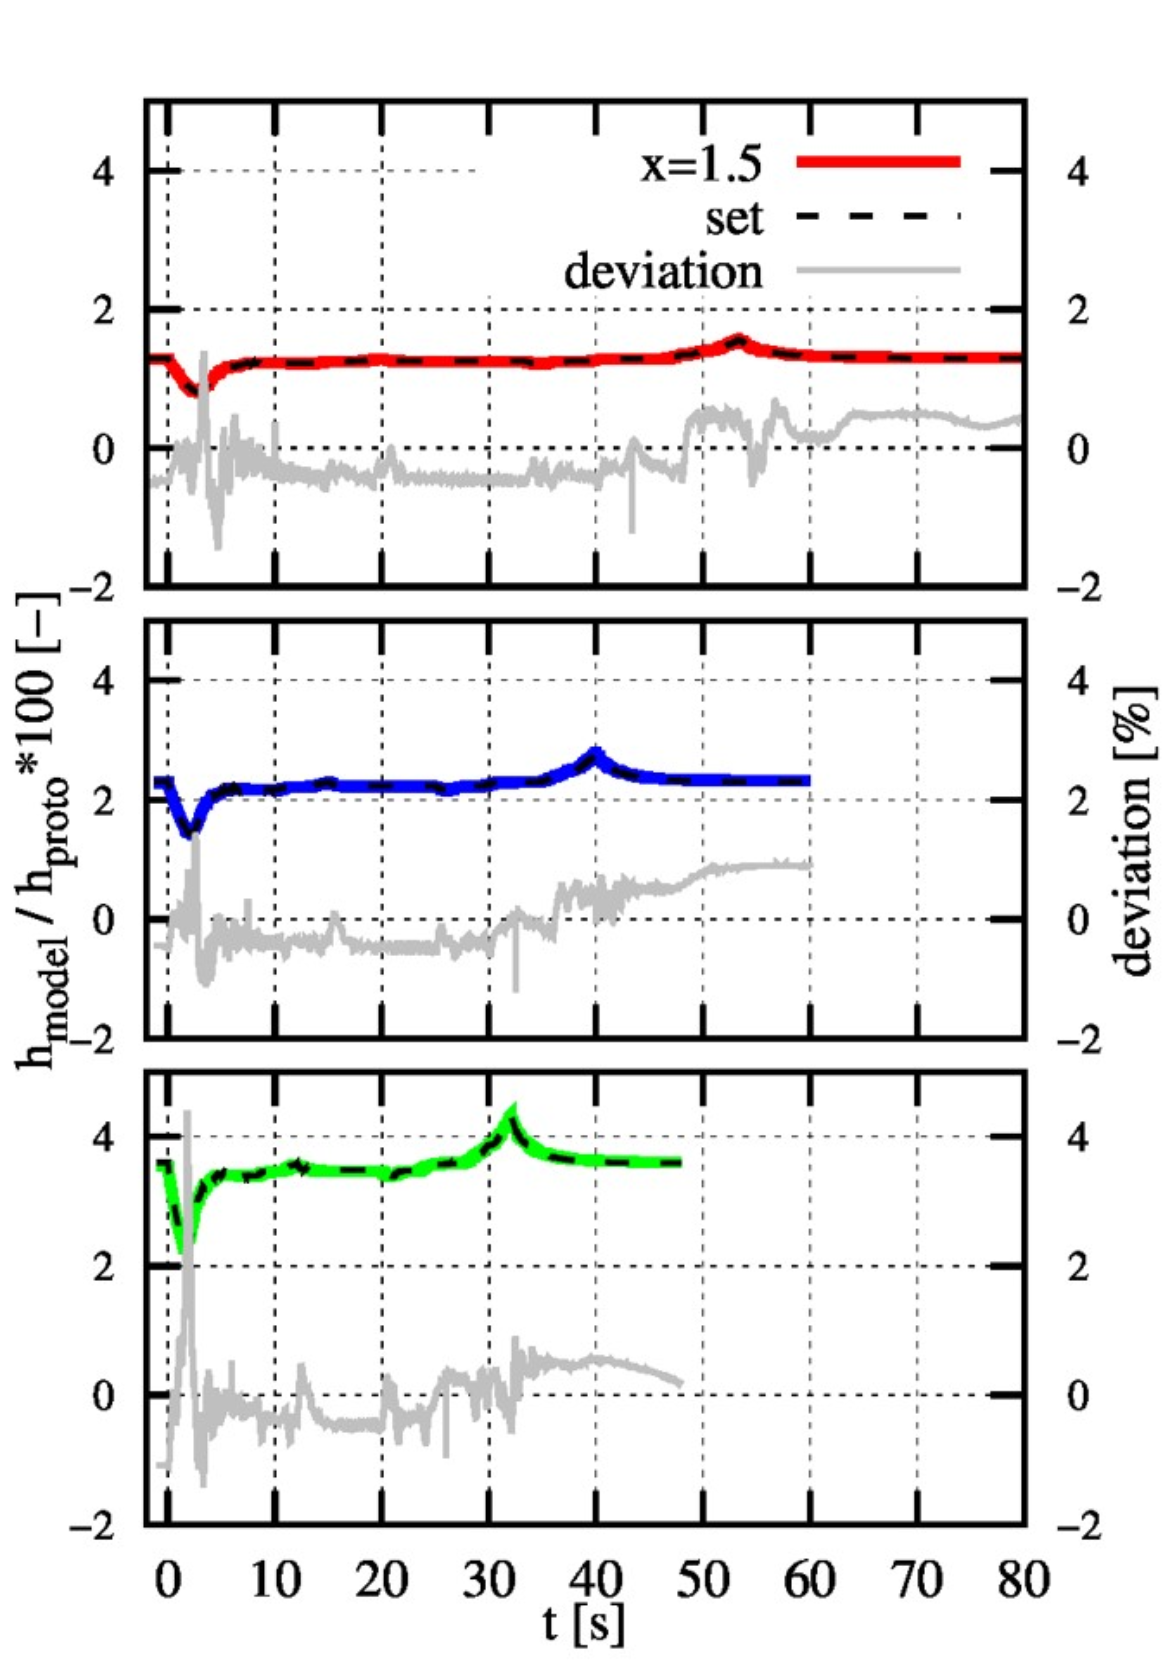
After an initial simulation of the entire transient process, an optimizer analyzes the deviation between the actual head and the target head for each time step. If the deviation is too high, the optimizer will adapt the performance of the pumps with a certain time offset. This results in a new performance curve and the simulation starts again. Fig. 3 shows the results after completion of the optimization process (colored curves). The setpoint curves from Fig. 1 are shown as dashed curves. The percentage deviations from setpoint and simulation results are shown in gray.
Result
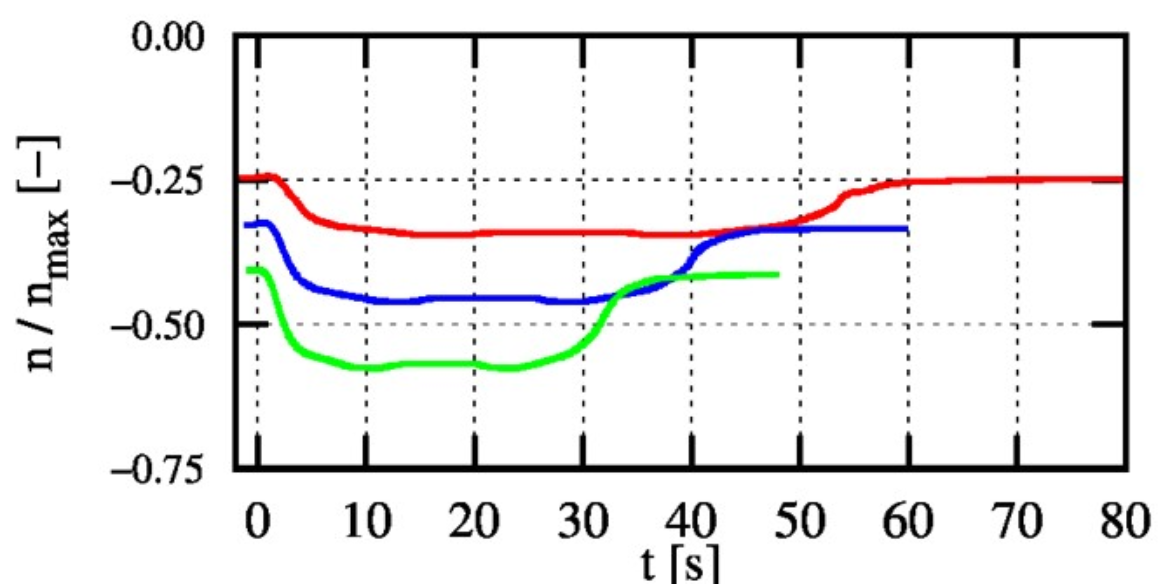
Fig. 3 shows that a reproduction of the transient prototype processes is possible. With the speed curves for the service pumps (Fig. 4) determined from the optimization, the model test on the real test rig can be carried out in a further step.


